
Figure 2.
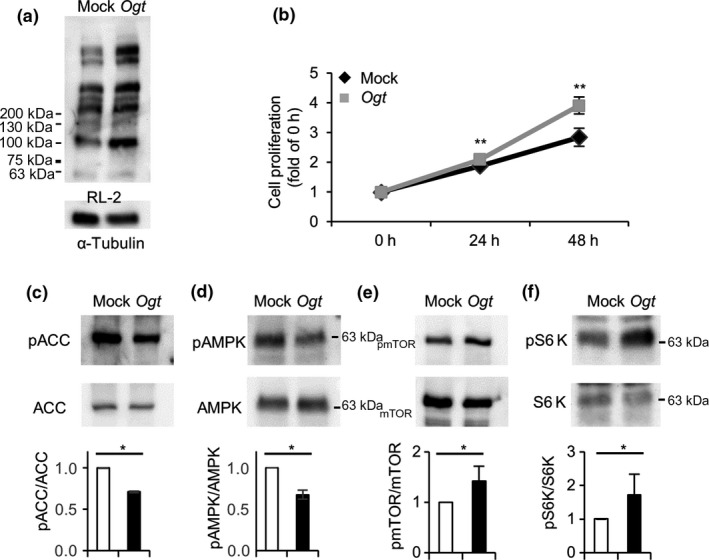
Ogt overexpression accelerated cell growth, and inactivated or activated the AMP‐activated kinase (AMPK) signaling pathway or mTOR pathway, respectively, in LoVo cells. Ogt cDNA or mock DNA was transfected into LoVo cells. Twenty‐four hours later, the cells was plated into 6‐well or 96‐well plates. (a) Cells in 6‐well plates were collected after 48 h, lysed, and subjected to Western blot analysis to examine O‐GlcNAcylation levels using RL‐2. (b) Cells in 96‐well plates were used to measure cell growth. The measurement was started the next day (0 h) using CCK‐8. Growth was measured at 0, 24, and 48 h. **0.01 < P < 0.05, Student's t‐test. (c–f) Lysates in (A) were also analyzed for the phosphorylation levels of acetyl CoA carboxylase (ACC) (c), AMPK (d), mTOR (e), and S6 kinase (S6K) (f) with Western blot analysis. The phosphorylation and expression levels of these proteins were analyzed using respective anti‐phospho‐ or total protein antibodies. The experiment was carried out several times and representative data are shown. Band densities were measured and ratios of phosphorylated to total proteins were analyzed statistically with Student's t‐test. *0.01 < P < 0.05. Molecular weight markers are indicated.