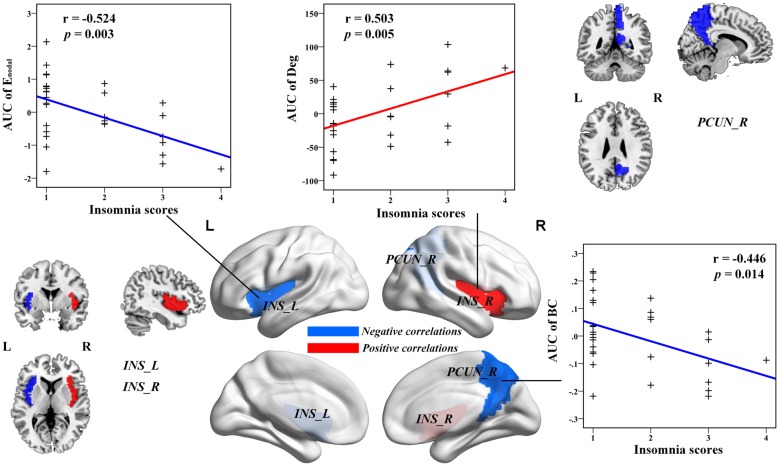
Figure 3.
The Pearson correlation between the AUC of the nodal network properties with insomnia scores in healthy participants with insomnia symptoms (p < 0.05, uncorrected, controlling for the age, gender, educational level, adjusted HAMA scores and adjusted HAMD score). The AUC of each nodal topology was computed over the range of 0.1 ≤ S ≤ 0.2 with an interval of 0.01. The red color stands for the positive correlation while the blue color reveals the negative correlation. For more detailed information see Table 3. L, left; R, right; AUC, area under the curve; BC, nodal betweenness centrality; Enodal, nodal efficiency; INS, insula; PCUN, precuneus.

