
Figure 9.
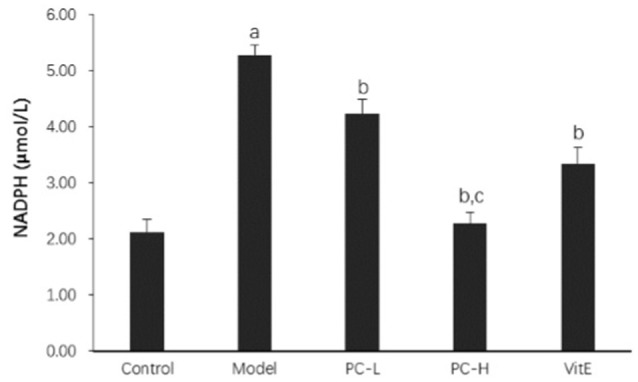
The effect of PC on the hepatic NADPH activity. Values are mean ± SD (n = 6). ap < 0.01 vs. the control group, bp < 0.01 vs. the model group, cp < 0.01 vs. PC-L group. NADPH, nicotinamide-adenine dinucleotide phosphate.
Official websites use .gov
A
.gov website belongs to an official
government organization in the United States.
Secure .gov websites use HTTPS
A lock (
) or https:// means you've safely
connected to the .gov website. Share sensitive
information only on official, secure websites.
The effect of PC on the hepatic NADPH activity. Values are mean ± SD (n = 6). ap < 0.01 vs. the control group, bp < 0.01 vs. the model group, cp < 0.01 vs. PC-L group. NADPH, nicotinamide-adenine dinucleotide phosphate.