
Figure 5.
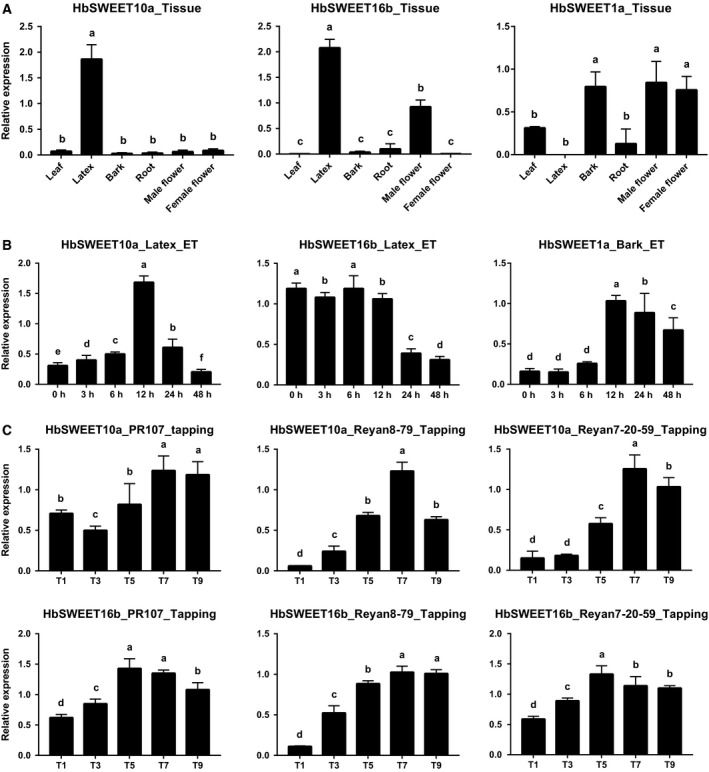
Expression analyses of HbSWEET10a, HbSWEET16b, and HbSWEET1a based on qPCR. (A), Expression of HbSWEET10a, HbSWEET16b, and HbSWEET1a transcripts in six tissues (leaf, latex, bark, root, male flower, and female flower). (B), Effect of Ethrel (2‐chloroethylphosphonic acid) treatment on HbSWEET10a and HbSWEET16b expression in latex, and HbSWEET1a expression in bark. (C), Transcript abundance of HbSWEET10a and HbSWEET16b in the first, third, fifth, seventh, and ninth tappings (T1, T3, T5, T7, and T9) on virgin Hevea trees of clones PR107, Reyan8‐79, and Reyan7‐20‐59. Values are means ± stdev of three biological replicates. Different letters indicate significant differences (Student's t‐test, P < 0.05).