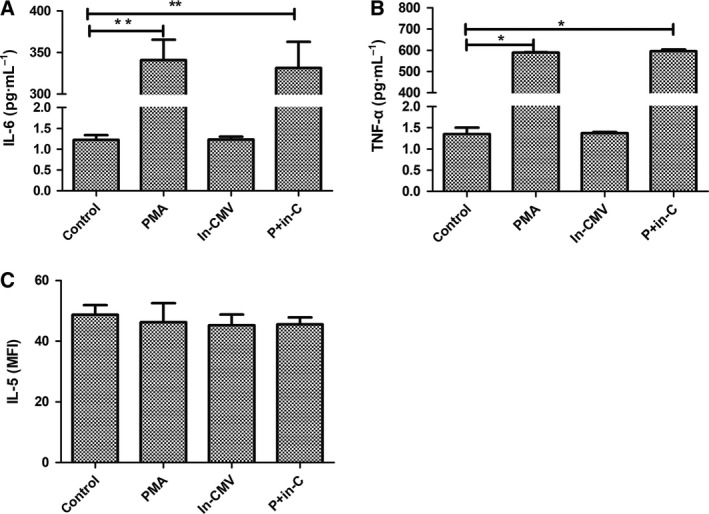
Figure 6.

Cytokine concentrations were measured from the culture supernatants. The columns show the averages, and the error bars indicate the standard deviation of three replicate samples in each group. *P < 0.05. **P < 0.01 compared two groups indicated.
