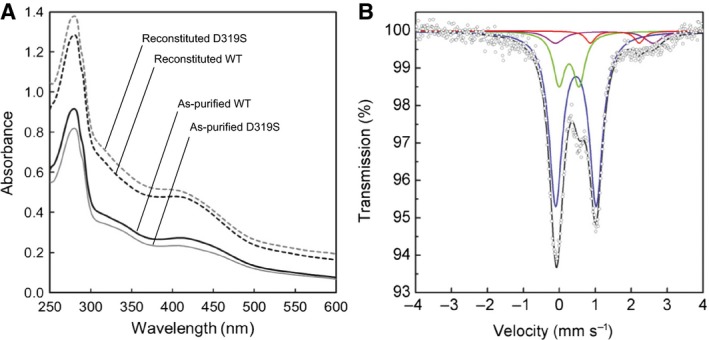
Figure 5.

Spectral analyses of D319S mutant of PqqE. (A) UV‐Vis spectra of the as‐purified and reconstituted D319S mutant and WT enzyme. (B) Mössbauer spectra of the reconstituted D319S mutant, recorded at 5 K. Simulated spectra are shown as follows: blue, [4Fe–4S]2+; green, [2Fe–2S]2+; red, free (noncluster) high‐spin Fe2+; purple, a doublet simulated for the unassigned signal; black, the sum of the simulated spectra.
