Figure 3.

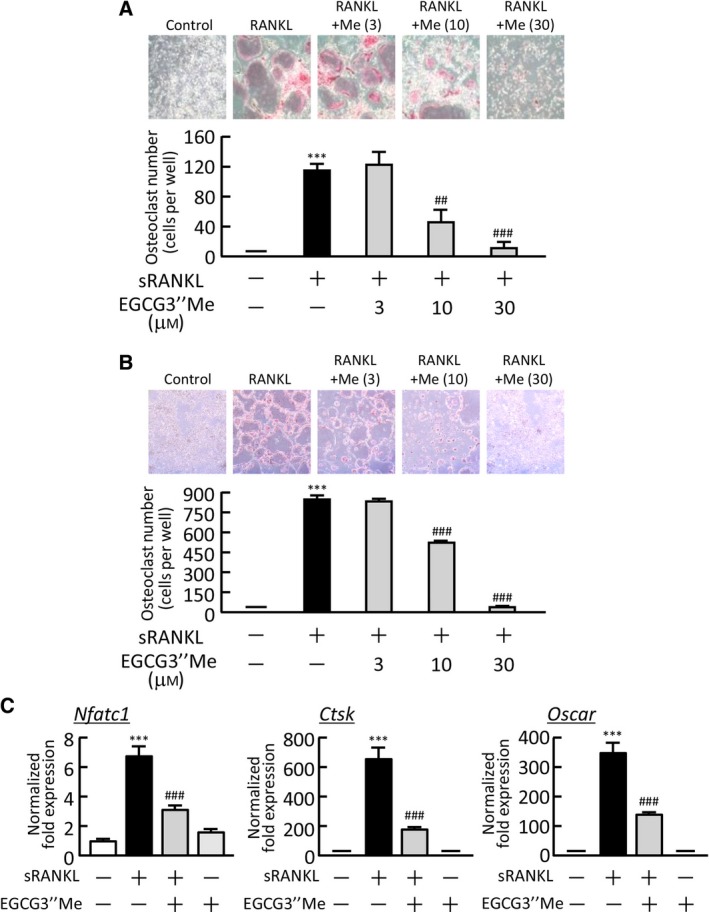
The effects of EGCG3″Me on osteoclast differentiation in osteoclast precursor cells. (A) Mouse bone marrow cells were cultured for 3 days with M‐CSF (100 ng·mL−1), and the BMMs formed were cultured for a further 5 days with M‐CSF (100 ng·mL−1) and sRANKL (100 ng·mL−1) in the presence or absence of EGCG3″Me (3–30 μm). The upper panel shows the TRAP‐stained cells in each cultured well. TRAP‐positive multinuclear osteoclasts were counted. The data are expressed as the means ± SEM of four wells. (B) RAW264.7 cells were cultured for 5 days in the presence or absence of sRANKL (100 ng·mL−1) and EGCG3″Me (3–30 μm). The upper panel shows TRAP‐stained cells in each cultured well. TRAP‐positive multinuclear osteoclasts were numbered. The data are expressed as the means ± SEM of three wells. (C) The mRNA expression of NFATc1 (Nfatc1), cathepsin K (Ctsk), and OSCAR (Oscar) in cultured RAW264.7 cells was analyzed by real‐time PCR. The data are expressed as the means ± SEM of three replicated wells in triplicate. A significant difference between the two groups was indicated; ***P < 0.001 vs. control, ## P < 0.01 and ### P < 0.001 vs. LPS.
