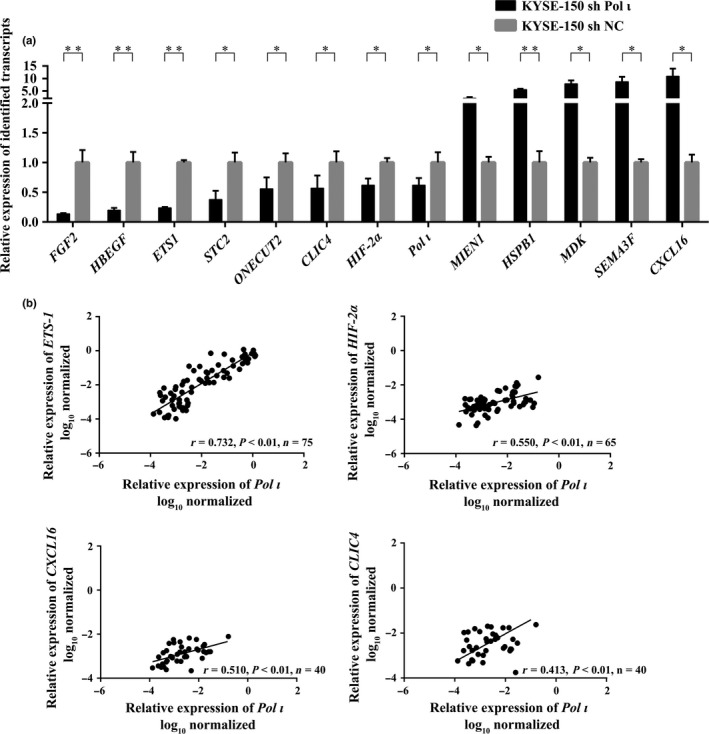
Figure 2.

Validation of differentially expressed transcripts in Pol ι downregulation cells. (a) Thirteen differentially expressed transcripts were validated by quantitative RT‐PCR (qRT‐PCR) in Pol ι downregulation KYSE‐150 cells (n = 3, mean ± SD). Student's t‐test was applied for statistical analyses, *P < 0.05, **P < 0.01. (b) The Pearson's correlation between expression of Pol ι and that of ETS‐1, Hif‐2α, CXCL16 and CLIC4 was evaluated, based on qRT‐PCR results using patient tissue samples.
