
Figure 2.
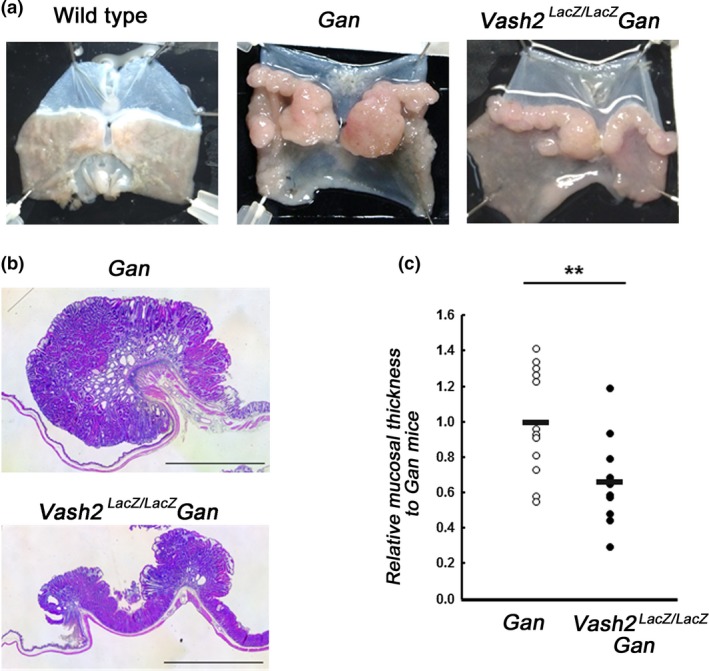
Suppression of gastric tumor growth by knockout of the Vash2 gene. (a) Representative macroscopic images of wild‐type normal stomach and Gan and Vash2 LacZ/LacZ Gan mouse gastric tumors at 30 weeks of age. (b) Representative images of H&E staining of Gan mouse (top) and Vash2 LacZ/LacZ Gan mouse (bottom) gastric tumors at 30 weeks of age. Scale bar: 2 mm. (c) Relative gastric mucosal thickness of Vash2 LacZ/LacZ Gan mouse gastric tumors (n = 11) to the mean level of Gan mouse tumors (n = 12) at 30 weeks of age. Each circle indicates the relative tumor thickness of individual mice. **P < 0.01 versus Gan mouse tumors.