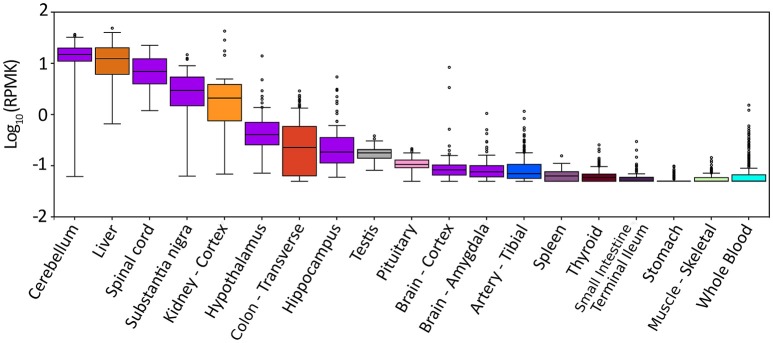
Figure 2.
Expression pattern of DAO gene in different tissues. Box plot of expression levels of DAO gene in different human tissues. Values are shown in RPKM (reads per kilobase of transcript per million mapped reads), calculated from a gene model with isoforms collapsed to a single gene. No other normalization steps have been applied. Box plots are shown as median and 25th and 75th percentiles; points are displayed as outliers if they are above or below 1.5 times the interquartile range. The data presented in this plot were obtained from the Genotype-Tissue Expression (GTEx) Project Portal, dbGaP accession number phs000424.v6.p1 on 09/04/2017 (https://www.gtexportal.org/home/gene/DAO).

