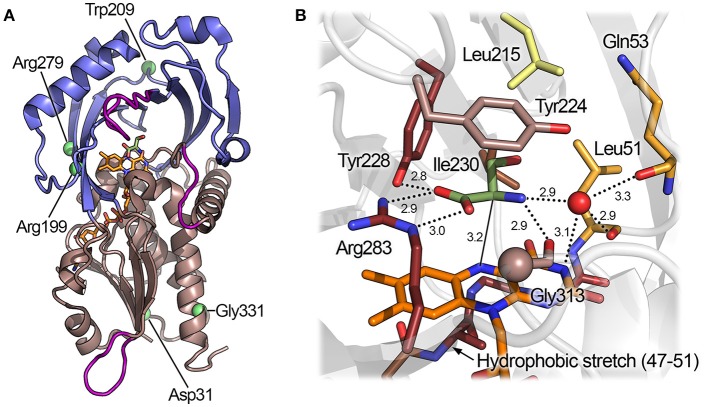
Figure 5.
Three-dimensional structure of hDAAO. (A) Schematic view of the spatial arrangement of protein domains in hDAAO (PDB code 2e49) (Kawazoe et al., 2007b). The FAD binding domain is in dark salmon color and the substrate binding domain is in blue. Regions showing the highest conformational diversity are in purple; α-helices, β-strands, and coils are drawn in cartoon representation. (B) Detail of the active site. The substrate D-Ser was modeled based on the structure of the enzyme in complex with imino-serine. Residues are colored according to their ConSurf score from darker (most conserved) to lighter (less conserved) color. Gly313 αC is represented as a sphere. The “putative” active-site water molecule is in red (see text). The FAD cofactor (orange) and the ligand (green) are shown in stick form. The H-bonds are represented by dotted lines while the distance between the α-H of the substrate and the N(5) of FAD is depicted with a continuous line.

