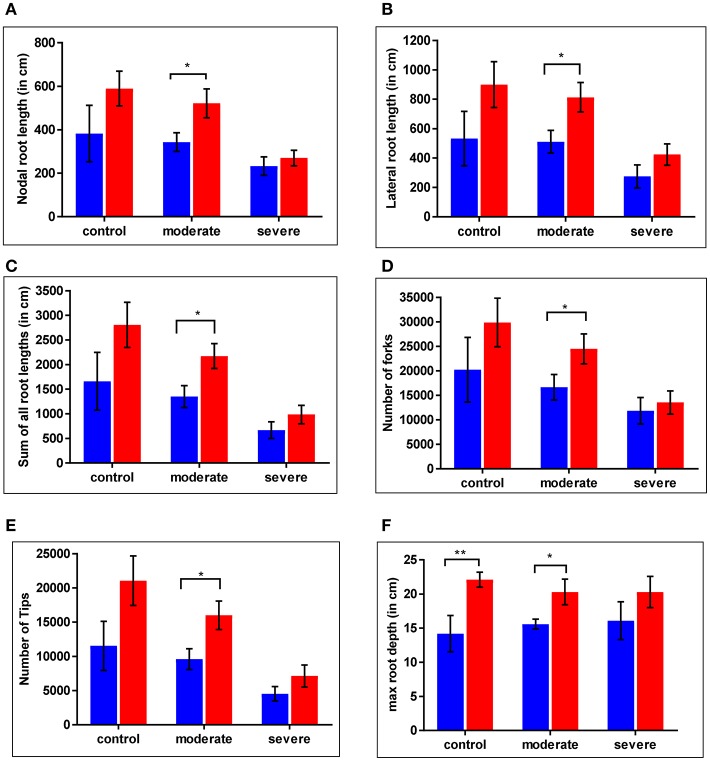
Figure 4.
Comparative differences were observed in root architecture in wild type (WT) and cpm2. Plants of two genotypes were grown in soils at different moisture levels. Roots were harvested, washed and stored in 75% ethanol until scanning and analysis. Significant differences were observed across the treatments. Values for (A) nodal root length (B) lateral root length (C) sum of all root length (D) number of forks (E) number of tips (F) max root depth are shown here. Data represents mean value ± standard error (SE); n = 5. WT and cpm2 are represented by blue and red bars, respectively. Stars (* and **) denote statistical significance (P ≤ 0.05 and P ≤ 0.01), respectively, between the two genotypes in a Student's t-test.

