Figure 3.

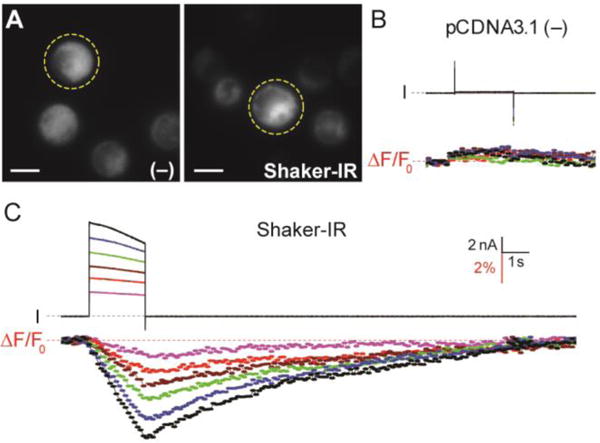
Fluorescent detection of K+ depletion in cells. (A) CHO cells transiently transfected with empty pCDNA3.1 plasmid (−) or Shaker-IR DNA labeled with 50 μM KNIR-1. Yellow dotted circles indicate the patch clamped cell in the field of view; fluorescent image scale bars represents 10 μm. Voltage-clamp fluorometry traces for (B) pCDNA3.1 (−) and (C) Shaker-IR: cells were held at −80 mV and currents (I) were elicited from 2-s command voltages from 0 to 100 mV in 20-mV increments. Total cellular fluorescence was simultaneously collected at 10 Hz by 10-ms excitation at 635 nm; F0 is the average fluorescence intensity of the first ten data points before the test depolarization. Voltage clamp fluorometry scale bars are for both (B) and (C); dotted line indicates zero current or change in fluorescence.
