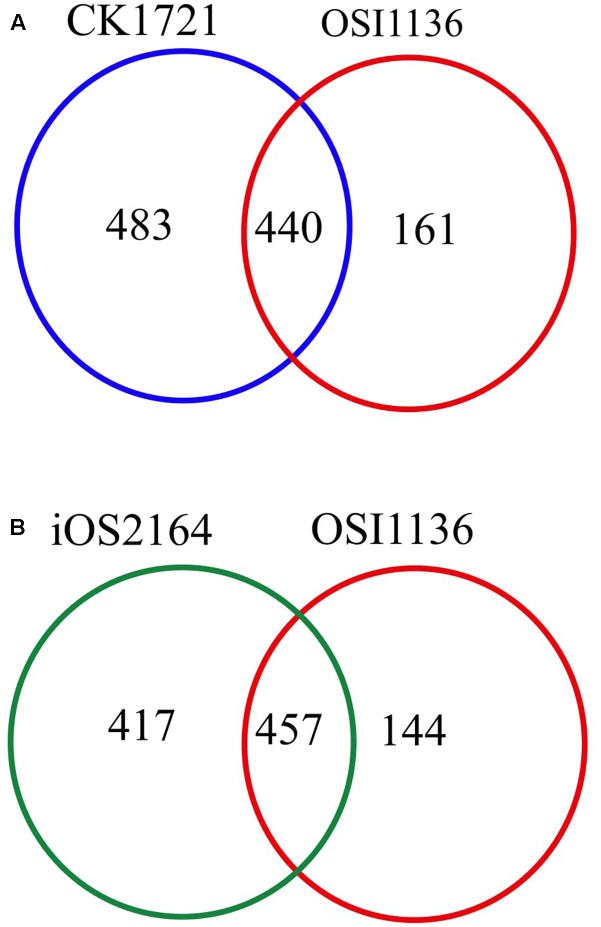
FIGURE 1.
Venn diagram showing comparison of the EC numbers corresponding to the respective reactions present in genome scale metabolic models (GSM) of Oryza sativa japonica and Oryza sativa indica. (A) Comparison of EC numbers associated with CK1721 (Chatterjee and Kundu, 2015) and OSI1136. (B) Comparison of EC numbers associated with iOS2164 (Lakshmanan et al., 2015) and OSI1136.

