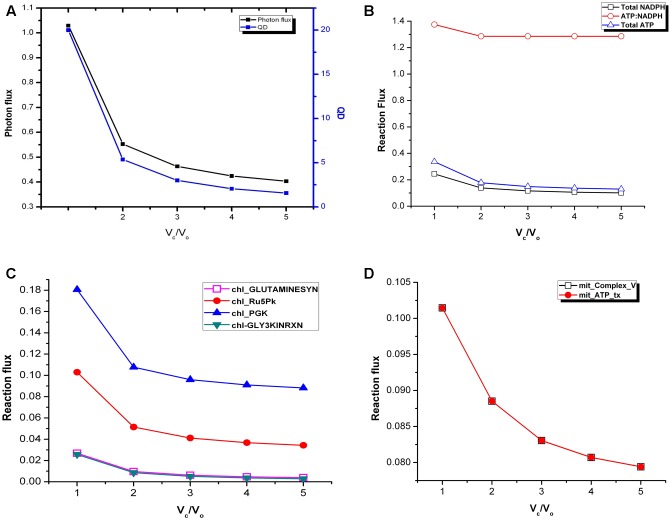
FIGURE 2.
Variations in photon flux, quantum demand and ATP:NADPH ratio under varying Vc/Vo. (A) The photon flux and the QD were maximum at Vc/Vo = 1. (B) The total ATP and NADPH generated were maximum and minimum at Vc/Vo = 1 and Vc/Vo = 5, respectively. ATP:NADPH ratio was found to be same from Vc/Vo = 2 to Vc/Vo = 5. (C) GS2, chl_Ru5Pk, chl_PGK, and GLYK carried maximum flux at Vc/Vo = 1 and decreased thereafter. (D) The ATP generation through mitochondrial Complex V and its release by the ATP transporter was maximum at Vc/Vo = 1. The reactions present in the chloroplast and mitochondrion are represented by chl_ and mit_ respectively. _tx represents transport reactions.

