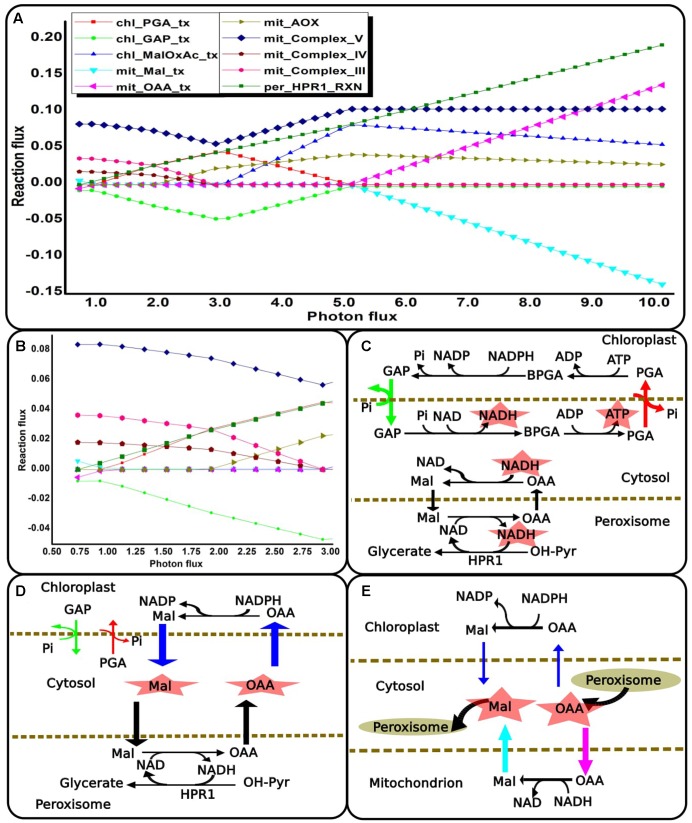
FIGURE 6.
Metabolic readjustments to maintain redox and ATP balance with increasing photorespiration. (A) Flux-plot for reactions and transporters that showed co-ordinated changes that occurred across the light range examined. A negative flux-value of intracellular transporter implies that the metabolite is exported to the cytosol compartment. (B) Enlarged flux-plot for low light intensity (0.73–3.0). (C–E) Metabolic networks corresponding to the flux-plot shown in (A). These show different ways in which the NADH demand of HPR1 can be fulfilled while maintaining cellular ATP balance. The reactions shown in color correspond to their flux-plot. The differences in arrow-width represent changes in respective reaction-fluxes and transporter-fluxes. ‘chl_’ and ‘mit_’ represent reactions in the chloroplast and the mitochondrion. ‘_tx’ represents transporters. HPR1, peroxisomal hydroxypyruvate reductase; GAP, glyceradehyde-3-phosphate; PGA, 3-phosphoglycerate; Pi, inorganic phosphate; BPGA, 1,3-bis-phosphoglycerate; Mal, malate; OAA, oxaloacetic acid; OH-PYR, hydroxypyruvate.

