FIGURE 7.
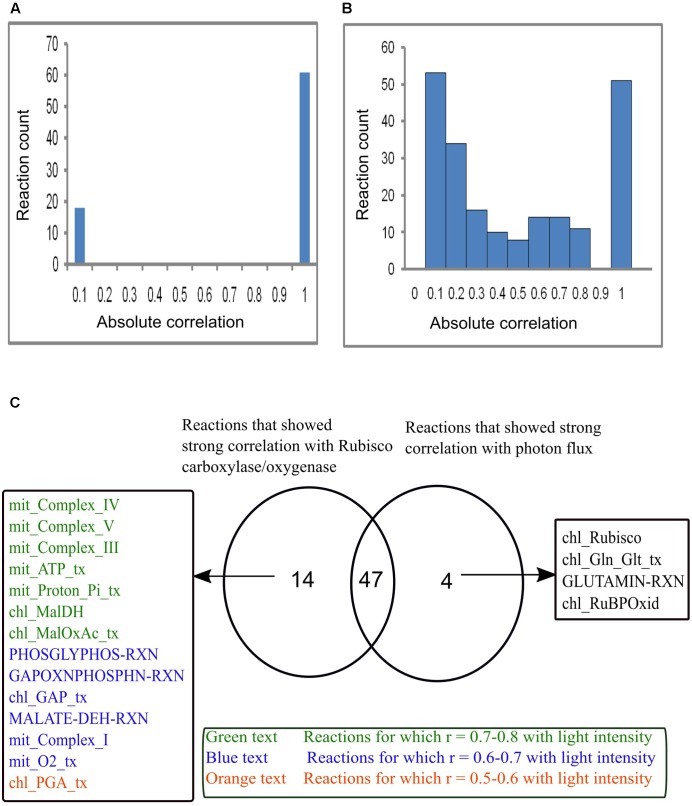
Reaction flux correlation with RuBisCO carboxylase/oxygenase and light intensity. (A) Reaction flux correlation with RuBisCO carboxylase/oxygenase. (B) Reaction flux correlation with light intensity. These were calculated as the absolute values of the pairwise (Pearson’s) correlation coefficients. The reactions that showed no change in flux were excluded. (C) Venn diagram showing comparison of the reactions that showed strong correlation (correlation coefficient, r varies between 0.9–1) with RuBisCO carboxylase/oxygenase and light intensity. Forty-seven reactions were found to be strongly correlated with both RuBisCO carboxylase/oxygenase and light intensity. Fourteen reactions that were highly correlated with only RuBisCO carboxylase/oxygenase showed varied correlation with light intensity. Four reactions were highly correlated only with light intensity. chl_ and mit_ represent the reactions present in the chloroplast and mitochondrion respectively. _tx represents the transport reactions.

