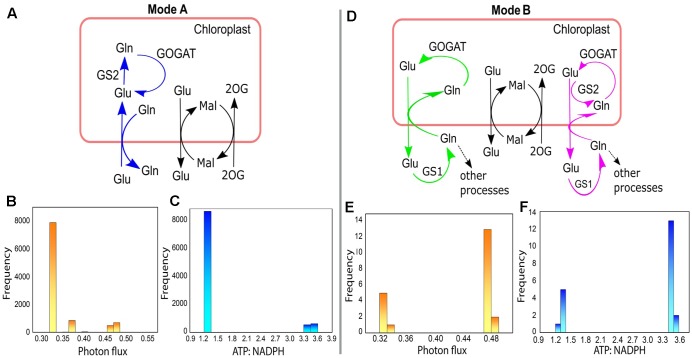
FIGURE 8.
Different modes of chloroplastic Glu–Gln transporter under varying enzymatic costs. (A) Mode A – chloroplastic Glu–Gln transporter operated to import Glu into the chloroplast and export Gln out of the chloroplast. GS2 was operative but not GS1. (B) Frequency plot showing range of photon flux for Mode A. (C) Frequency plot showing ATP:NADPH ratio for Mode A. (D) Mode B – chloroplastic Glu–Gln transporter operated to export Glu out of the chloroplast and import Gln into the chloroplast. Here, GS2 was not operative (marked in green) except for once when both GS1 and GS2 were active (marked in pink). The transporters for Mal-2OG and Mal-Glu were always operative with the same flux. (E) Frequency plot showing range of photon flux for Mode B. (F) Frequency plot showing ATP:NADPH ratio for Mode B. Glu, glutamate; Gln, glutamine; Mal, malate; 2OG, 2ketoglutarate; GS1, cytosolic glutamine synthetase; GS2, chloroplastic glutamine synthetase; GOGAT, glutamate synthase.

