Fig. 6.

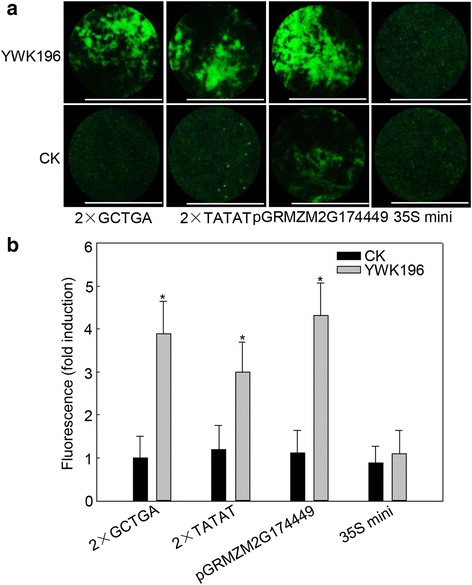
Determination of GCTGA and TATAT induction by R. solani in NB leaves. a GFP fluorescence assay of NB leaves expressing 2 × GCTGA and 2 × TATAT after treatment with R. solani strain YWK196 for 24 h. Bars = 5 mm. b Quantitative fluorometric assay of NB leaves. The fluorescence value was calculated relative to CK of 2 × GCTGA. The full-length GRMZM2G174449 promoter and 35S minimum promoter were used as the positive and negative controls, respectively. Asterisks indicate statistically significant differences, as determined by Student’s t-tests (*P < 0.05)
