
Fig. 2.
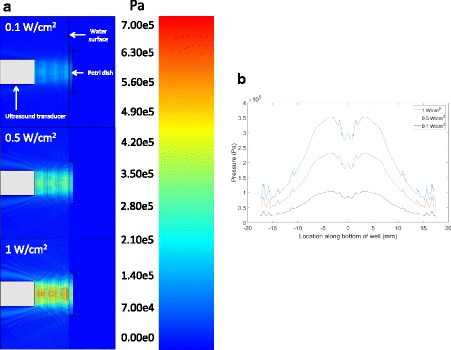
a Pressure maps of experimental setup (side view) generated using PZFlex modeling software for 800 kHz ultrasound applied at intensities of 0.1 W/cm2, 0.5 W/cm2 and 1 W/cm2. b Pressure profiles at the location of the cell monolayer at the bottom of the Petri dish for 800 kHz ultrasound applied at intensities of 0.1 W/cm2, 0.5 W/cm2 and 1 W/cm2