Fig. 1.

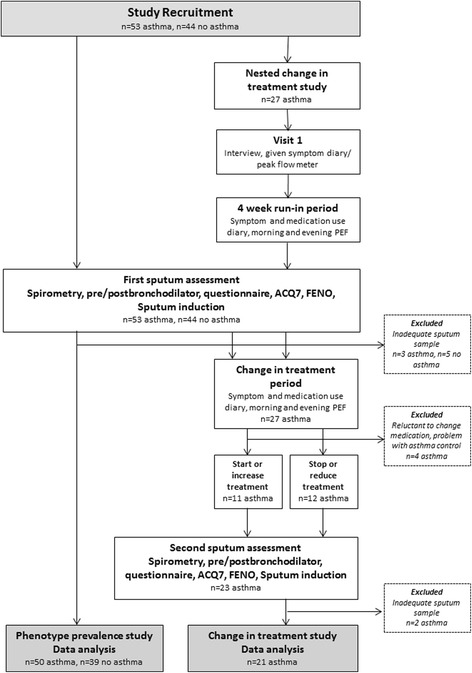
Study plan flow chart. Recruitment of participants, and the assessments involved in the phenotype prevalence and change in treatment components of the study

Study plan flow chart. Recruitment of participants, and the assessments involved in the phenotype prevalence and change in treatment components of the study