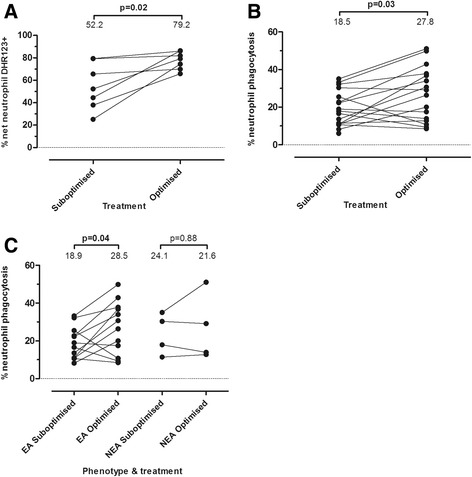
Fig. 3.

Sputum neutrophil functional parameters (as assessed using flow cytometry). Data represent CIT participants who produced an adequate sample for neutrophil oxidative burst (n = 7) or phagocytosis measurement (n = 16) at both visits. Groups are stratified on the basis of treatment status (sub-optimised or optimised). a – change in % sputum neutrophils undergoing oxidative burst after stimulation with PMA, b – change in % sputum neutrophils that are capable of phagocytosing fluorescent zymosan beads in culture at 37 °C, c- change in % sputum neutrophils that are capable of phagocytosing fluorescent zymosan beads in culture at 37 °C when stratified into EA/NEA. Median values are expressed at the top of each group
