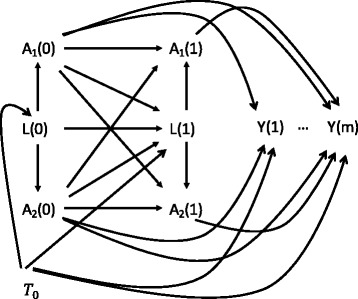
Fig. 1.

Causal directed acyclic graphs corresponding to the structure of simulated data. A1 and A2 are the treatments, L is the time-dependent confounder and Y is the outcome. Case 1 and 2 considered all relationship between A1, A2 and L. The time-dependent Confounder was strongly associated to the treatments A1 and A2 in the case 1 whereas it was weakly associated to the treatments A2 in the case 2. Coefficients of the time-dependent confounder in the functions of treatment prediction were set to 0.004 and 0.001, respectively. Case 3: relationship between A2 and L were not considered. Data were simulated from a marginal structural model as the confounding in the exposures-outcome relationship arises via T0 as follows: Y (m + 1) ← T0 → L (m) → A1 (m), Y (m + 1) ← T0 → L (m) → A2 (m)
