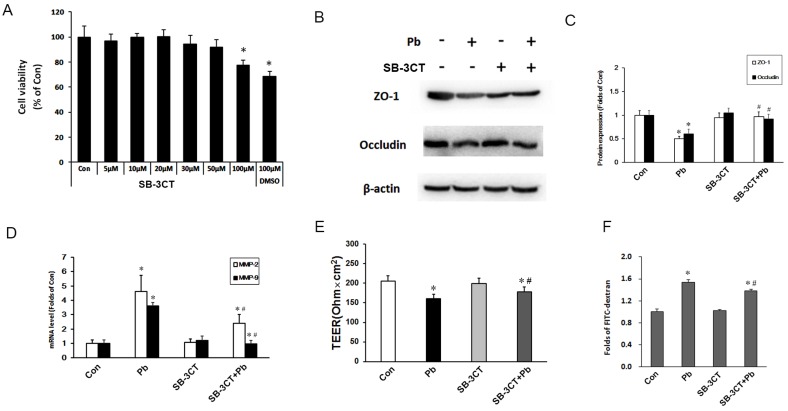
Figure 6.
Determination of the in vitro BBB barrier permeability after inhibition of MMP-2/9. (A) Cell viability of C6 cells after treatment with SB-3CT in response to Pb exposure. (B) Protein level of MMP-2/9 in response to SB-3CT or Pb in abovementioned C6 + ECV304 cells co-culture system, and Pb or SB-3CT were added in the medium of C6 cells. (C) Gray analysis of MMP-2/9 protein level. Data are expressed as the means ± SD (n=3), * p < 0.05 vs. control. (D) mRNA level MMP-2/9 in response to SB-3CT or Pb. (E) Data of TEER and (F) flux of FTIC-dextran flux. Data are expressed as means ± SD (n=3), *p < 0.05 vs. con, #p < 0.05 vs. Pb.

