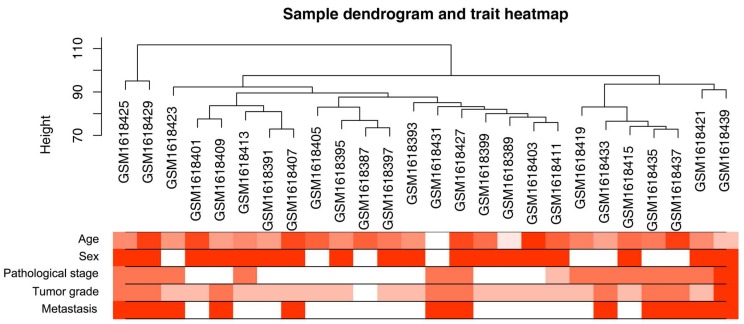
Figure 2.
Clustering dendrogram of 26 tumor samples and the clinical traits. The clustering was based on the expression data of differentially expressed genes between tumor samples and non-tumor samples in ccRCC. The red color represented metastasis and female. The color intensity was proportional to older age as well as higher pathological stage and tumor grade.

