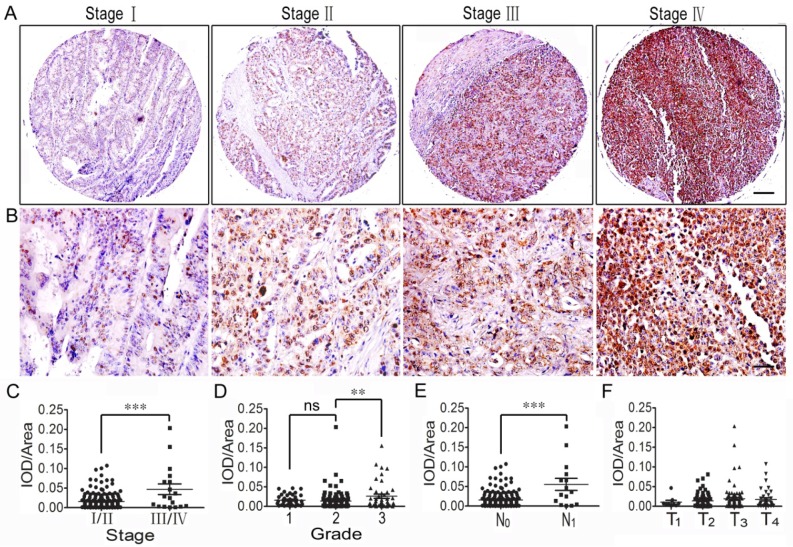
Figure 5.
Correlation analysis between LOX expression and clinicopathologic features of colorectal cancer. (A) LOX expression of CRC tissues across individual AJCC-7th stages I-IV. Bar = 200 µm. (B) LOX expression of CRC tissues across individual AJCC-7th stages I-IV. Bar = 50 µm. (C) LOX expression was significantly stronger in stage III/IV CRC tissues than in stage I/II tissues. (D) LOX expression was stronger in grade 3 CRC tissues than grade 1 and 2 tissues, but no significant difference was found between grade 1 and 2 tissues. (E) LOX expression in CRC with lymph node metastasis (N1) was significantly stronger compared to that with no lymph node metastasis (N0). (F) There was no difference in LOX expression in the different T stages (T1-T4). **, p<0.01; ***, p<0.001.

