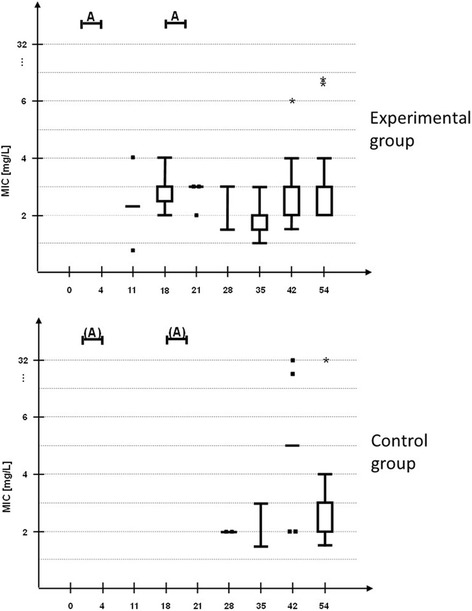
Fig. 2.

Distribution of MIC values of E. coli isolates. MIC values were determined by Etest® during the experimental trial in the experimental group (EG) (n=6 pigs) compared to the control group (CG) (n=6 pigs) housed in the same stable. MIC values are represented in Tukey boxplots, points represent single MIC-values, asterisks outliers. Up to 10 E. coli colonies per animal and day were isolated from Endo agar plates supplemented with 0.125 mg/L enrofloxacin to screen for MIC-shifts (total number of isolated E. coli colonies per day represented in brackets). A= intramuscular administration of EG with 2.5 mg/kg bw for three days
