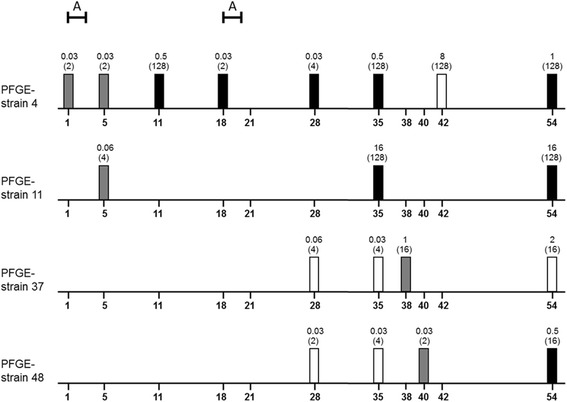
Fig. 3.

Distribution of four E. coli PFGE strains with susceptibilities shifts against fluoroquinolones. The X-axis represents the trial period (in days). The columns show the origin of E. coli strains (white: CG, grey: environment, black: EG). The data above the columns are MIC values against enrofloxacin and nalidixic acid (in brackets). A=administration period
