Fig. 1.

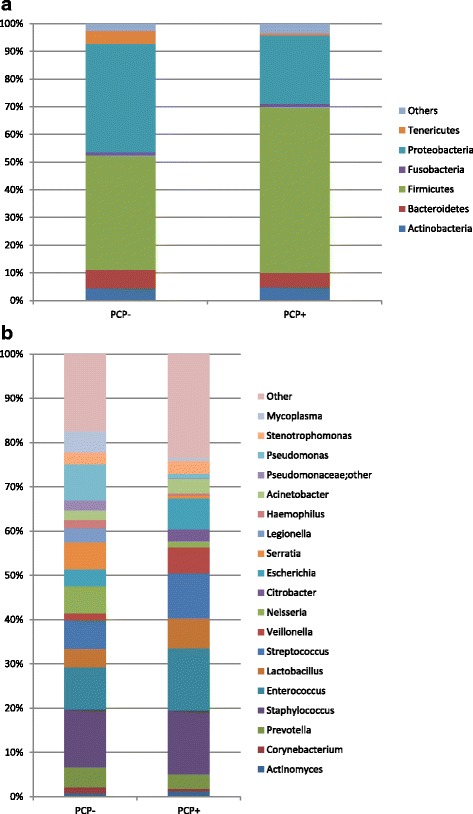
a + b Composition of the bacterial community at the phylum (a) and genus (b) level for PCP+ and PCP- samples. Phyla and genera with a minimum percentage of 1% are shown

a + b Composition of the bacterial community at the phylum (a) and genus (b) level for PCP+ and PCP- samples. Phyla and genera with a minimum percentage of 1% are shown