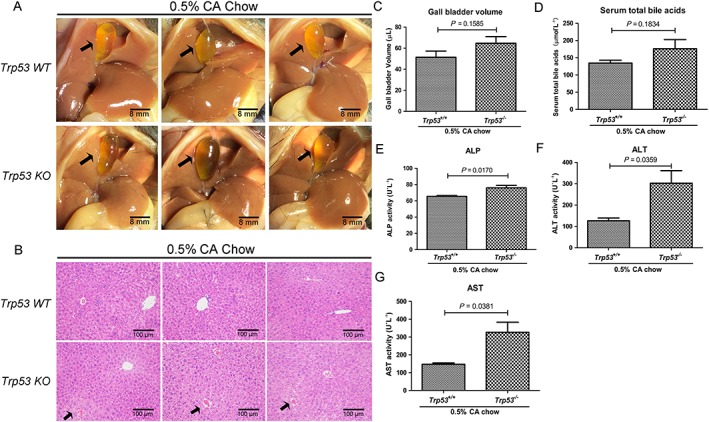
Figure 8.

Effects of excessive cholic acid (CA) diet on cholestasis in Trp53‐WT and Trp53‐null mice. Mice were fed a chow diet supplemented with 0.5% (wt.wt‐1) CA for 4 days, and then samples were collected. (A) Morphology of representative livers. Gall bladders are indicated by black arrows. (B) Representative H&E stained liver sections (10 × 10). Apparent subcapsular necrotic foci in the liver are indicated by black arrows. (C–G) Gall bladder volume, levels of serum total bile and serum ALP, ALT and AST activities. Data are the mean ± SEM (n = 5). *P < 0.05. KO, knockout.
