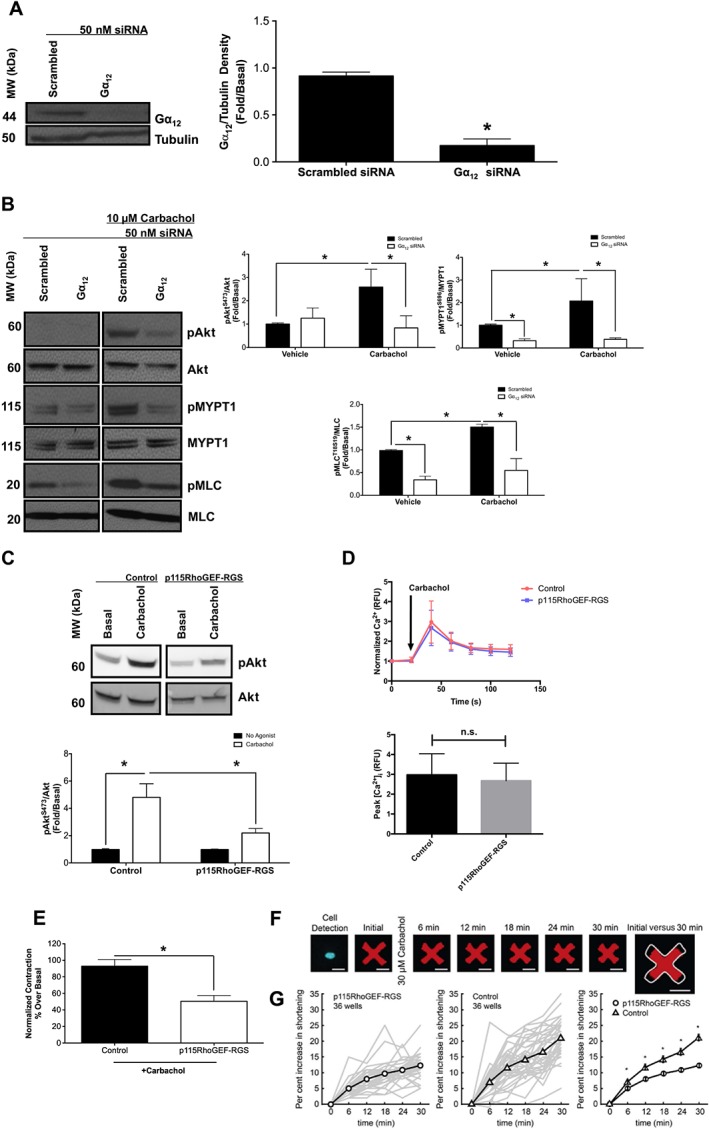
Figure 3.

Effects of Gα12 siRNA and p115RhoGEF‐RGS overexpression on M3 receptor‐mediated activation of the PI3K/ROCK/MLC axis in HASMCs. (A–C) Measurement of phosphorylation responses to carbachol (10 μM, 10 min) and protein expression in primary HASMCs after transfection with Gα12 or scrambled siRNA (50 nM, 72 h post‐transfection). (A) Effect of Gα12 or scrambled siRNA on protein expression. Data normalized to tubulin expression in the same samples. (B) Effect of carbachol on Akt, MYPT1 and MLC phosphorylation at S473 (pAkt), T696 (pMYPT1) and S19 (pMLC) after transfection with Gα12 or scrambled siRNA. pAkt, pMYPT1 and pMLC data were normalized to total Akt (Akt), total MYPT1 (MYPT1) and total MLC (MLC). (C) Effect of p115RhoGEF‐RGS overexpression on carbachol‐induced Akt phosphorylation in hTERT‐immortalized HASMCs. Control refers to hTERT‐immortalized HASMCs that underwent G418 selection. (D) Effect of p115RhoGEF‐RGS overexpression on carbachol‐induced intracellular calcium mobilization in hTERT‐immortalized HASMCs. Data are expressed as fold change over untreated (basal) samples that were measured on the same gel or plate. Data (means ± SD) are from five independent donors (n = 5). (E) Effect of p115RhoGEF‐RGS overexpression on carbachol‐induced contraction as measured by MTC analysis in hTERT‐immortalized HASMCs (control, n = 278; p115RhoGEF‐RGS, n = 237). (F) Representative images of a typical modified HASMC responding to carbachol. A single nucleus confirms the presence of one cell. The addition of carbachol induces increased force generation by the cell onto the contractible fluorescent micro‐pattern, resulting in a smaller pattern over time. The white outline in the rightmost figure depicts the initial area of the cell before carbachol stimulation. (G) Quantification of cell contraction to carbachol in p115RhoGEF‐RGS‐expressing and control HASMCs. Line plots depict the evolution of contractile forces, shown as the median population‐wide responsiveness in each of 36 technical experimental replicates (thin grey lines) and their mean (heavy lines) for both the p115RhoGEF‐RGS‐expressing and control HASMCs. Comparison of the heavy lines in the rightmost figure demonstrates a significant inhibition in contractile responsiveness in p115RhoGEF‐RGS‐expressing HASMCs compared with control HASMCs. Bars represent SEM, with each thin grey line representing between 13 and 52 isolated cells analysed per replicate, corresponding to ≥800 total cells analysed per condition. Data (means ± SEM) are from five biological replicates (n = 5). *P < 0.05, significantly different as indicated; in A, D, E unpaired t‐test: in B, C, G, one‐way ANOVA with Bonferroni's post test. Control in all experiments refers to hTERT‐immortalized HASMCs that underwent G418 selection. n.s., not significant; RFU, relative fluorescence unit.
