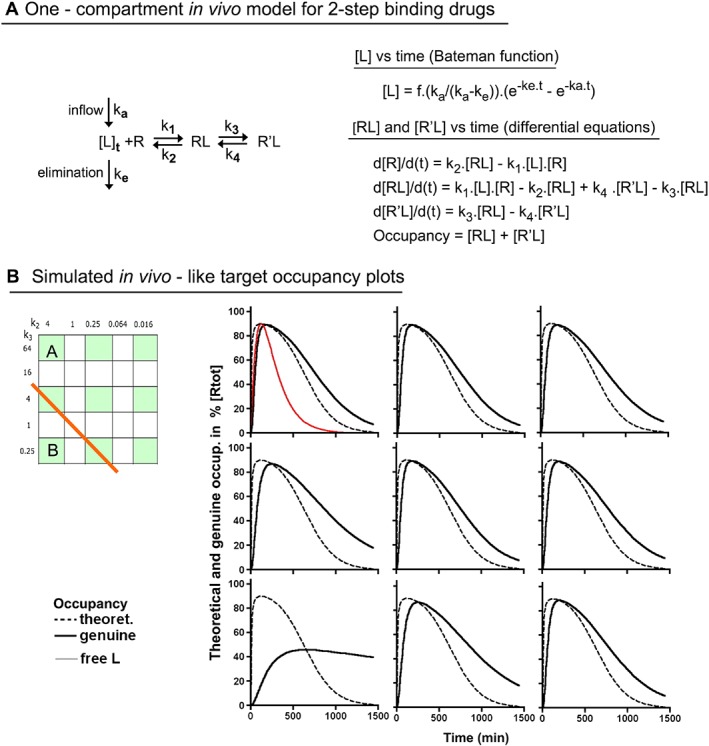
Figure 2.

Simulated occupancy over time plots after a single in vivo dosing of nine two‐step binding Drugs (including Drugs A and B) according to the constant [Lmax]/K D* ratio paradigm. (A) The simulations are based on the one‐compartment in vivo body model in where first‐order rate constants ka and ke correspond to the inflow/input and the elimination/clearance of the drug respectively. The Bateman function (Garret, 1994) defines how the concentration of free drug, [L], near the target evolves with time (see Chapter 2). The differential equations at the right side describe the time (t)‐dependent changes in each mode of target occupancy after dosing. To this end, the equations are consecutively solved over very small time intervals till the desired time point is attained, as previously described (Vauquelin et al., 2001). (B) Comparison of the occupancy (i.e. [RL] + [R′L]) profiles of the nine highlighted drugs in the grid at the left. The Bateman function was adjusted for all to yield 90% maximal occupancy in case of instant equilibrium. To facilitate comparison, [L] (in red) is normalized to reach the same apex (all alike, therefore only shown for Drug A). Broken black lines account for the occupancy in case of instant equilibrium and solid black lines account for the actual drugs. The occupancy half‐life (Occ t 1/2) values are provided in Section E of Supporting Information Table S1.
