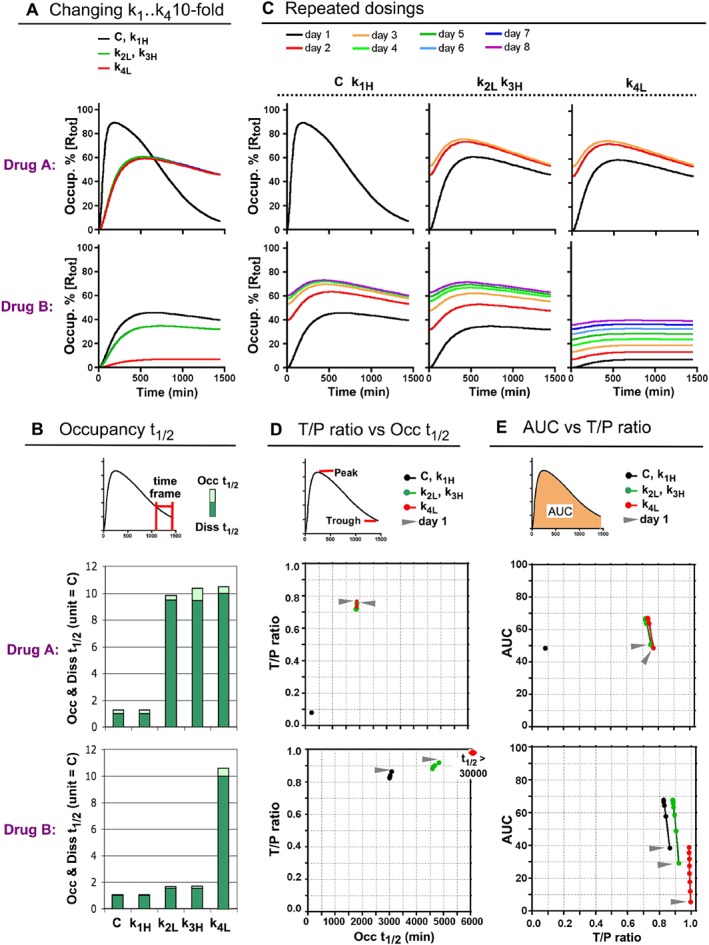
Figure 3.

Effect of altering the individual microscopic rate constants of Drugs A and B on their in vivo occupancy profile after a single dose (A and B) and repeated daily dosings (C to E). (A) Simulated occupancy over time plots of the parent Drugs A and B (black line, here used as control) and their ‘variants’ with 10‐fold increased k1 or k3 or decreased k2 or k4 (denoted with the suffix −k1H, −k3H, −k2L and −k4L, respectively). The plots overlap for the parent drugs and their −k1H variants and also for the −k2L and −k3H variants. (B) Effect of a 10‐fold change of the microscopic rate constants on the Diss t 1/2 and Occ t 1/2 values. Curves are shown in Panel A. The Diss t 1/2 values of the parent drugs, ‘C’, are assigned as unity to better appreciate this effect. Occ t 1/2 values account for the decline in occupancy during the 1050–1440 min post‐dosing interval for all except for the very slow dissociating B‐k4L variant for which a 1050–2880 min interval was chosen due to the late manifestation of its peak occupancy (Supporting Information Figure S3). Those time frames are also adopted for the further Occ t 1/2 determinations. (C) Effect of up to eight repeated daily dosings on the target occupancy over time plots by Drugs A (top) and B (bottom) and their variants. After each dosing, [L] is adapted to include the free drug that remained 24 h after the previous dosing. If the occupancy profile no longer changes after a given day, then the curves after that colour‐coded day are not shown. (D) For the same drugs as in Panel C: trough‐to‐peak, T/P, ratios (please see top of the panel for definition) are plotted versus the Occ t 1/2 values (abscissa). Data (dots) for the first dosing of each drug are pointed to by an arrow and are linked to the data for subsequent dosings (only shown when they differ sufficiently from those of the previous day). Overall, the data closely tally with a bi‐exponential paradigm (Supporting Information Figure S4). (E) AUC versus T/P ratios (abscissa) of the same drugs. AUCs account for the 24 h post‐dosing target occupancy and are expressed as % of the theoretical maximum, that is, for continuous full occupancy.
