
Fig. 2.
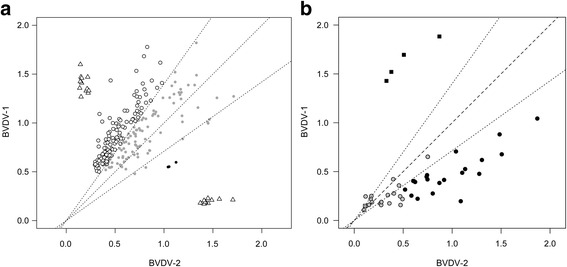
Dispersion plot of ELISA reactivity versus BVDV-1 recombinant E2 (Y axis) and BVDV-2 recombinant E2 (X axis). Diagonal and envelope lines represent equal reactivity and cut-off discrimination, respectively. Panel a: Reactivity of pooled milk samples. Strain specific control sera are shown as white triangles. White dots denote pool milk samples reactive against BVDV-1 antigen. Grey dots denote indeterminate samples. Black dots denote pools from a single dairy farm reactive against BVDV-2 antigen. Panel b: Spot test on young animals. Grey dots denote negative or indeterminate samples. Black dots denote individual serum samples reactive against BVDV-2 antigen. Black squares denote individual serum samples from a BVDV-1 positive farm