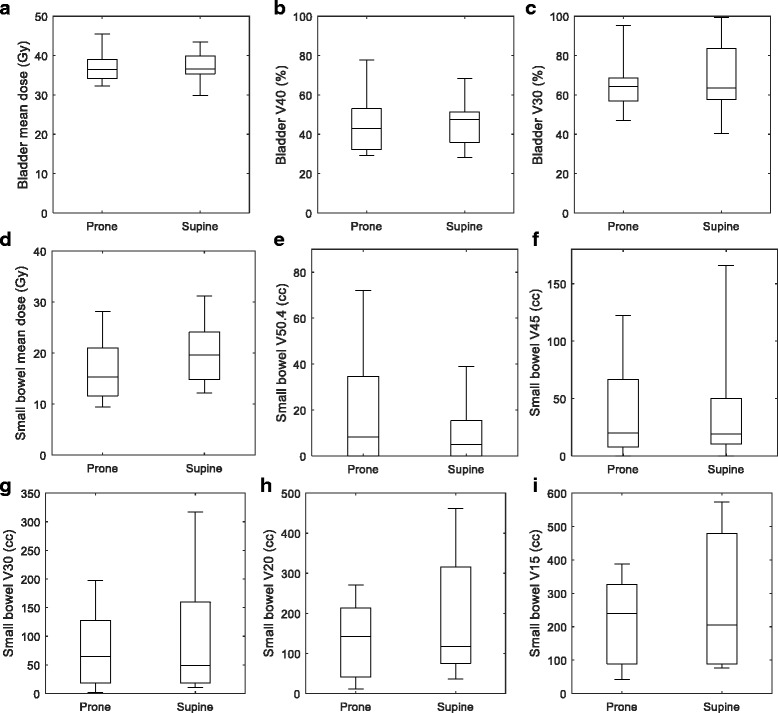
Fig. 2.

Bladder a mean dose, b V40, and c V30 box-whisker plots for prone and supine orientations. Small bowel d mean dose, e V50.4, f V45, g V30, h V20, and i V15 box-whisker plots. The first and third quartiles are indicated by the ends of the box, with the line in the middle indicating the median. The “whiskers” display the maximum and minimum of the data. No outliers were considered in these plots
