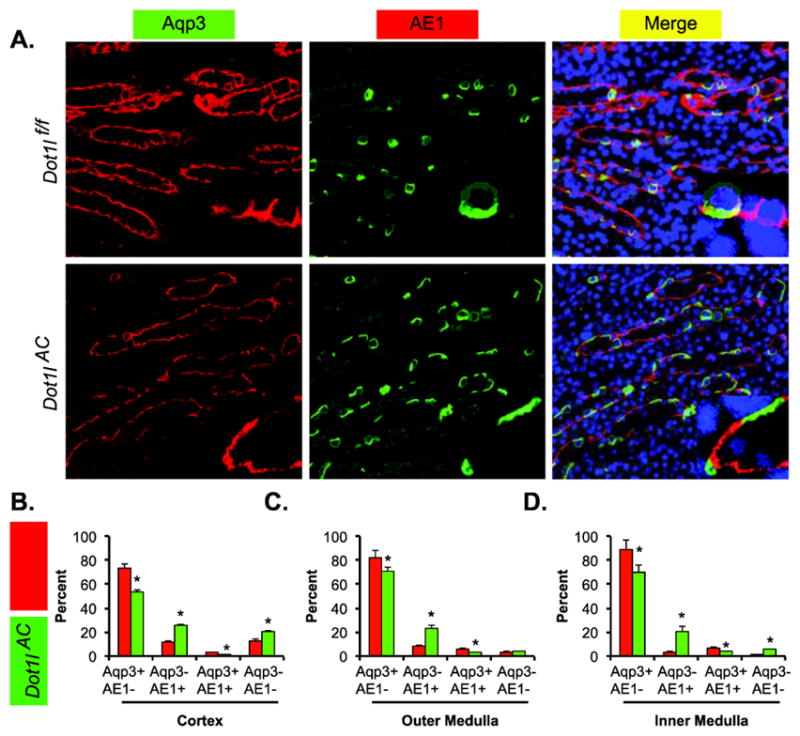
Figure 3.

Double immunofluorescence staining analyses of Aqp3 and AE1 showing less PCs and more α-ICs in Dot1lAC than in control mice. (A) Representative IF images showing staining of Aqp3 (red) and AE1 (green) as PC and α-IC markers, respectively, in the outer medulla of adult Dot1lf/f and Dot1lAC mice. The insert shows the enlarged boxed areas. Scale bar: 100 μM and 25 μM for insert. (B–D). Bar graphs showing the relative percentages of the 4 groups based on the staining of the two markers in the CNT/CD cells in the cortex (B), outer medulla (C), and inner medulla (D) of Dot1lf/f and Dot1lAC mice. In all cases, *P < 0.05 vs. Dot1lf/f.
