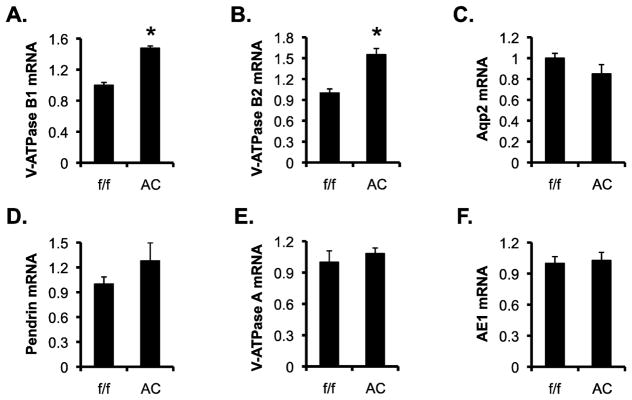
Figure 5.
V-ATPase B1 and B2 mRNA levels are significantly higher in Dot1lAC vs. Dot1lf/f mice. (A–F) Real-time RT-qPCR analyses of the total RNAs isolated from adult Dot1lf/f and Dot1lAC kidneys (n=6 mice/genotype) for expression of the genes as indicated, with β-actin as internal control and mRNA levels set to 1 in Dot1lf/f mice. In all cases, *P < 0.05 vs. Dot1lf/f.

