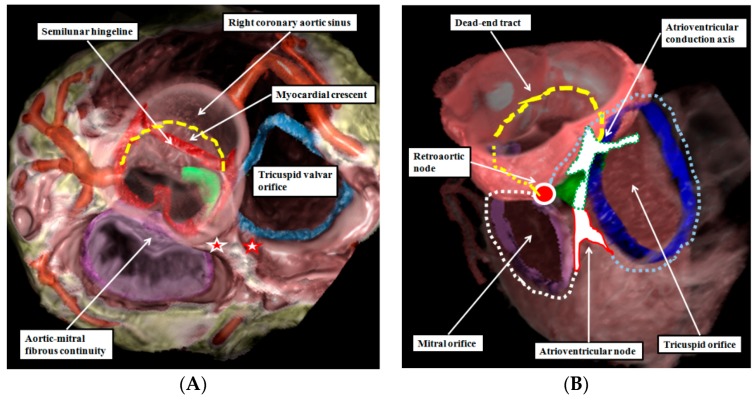
Figure 5.
The images are taken from a dataset prepared from a patient undergoing investigation for coronary arterial disease using multi-detector computed tomography. The dataset has been reconstructed to show the semilunar hingelines of the aortic valve in red, the annulus of the tricuspid valve in blue, and the location of the membranous septum in green. The reconstruction is viewed from the cranial aspect in the left hand panel (A), with the left side of the heart seen to the left hand of the observer. The location of the dead-end tract is marked by the yellow dashed line. The white star with red borders shows the location of the atrioventricular node, while the red star with white borders shows the location of the retroaortic node; The right hand panel (B) shows the same reconstruction viewed obliquely from above and from the right. In this view, the location of the atrioventricular node is shown by the while area with red borders, with the atrioventricular conduction axis shown as the white area with dotted green borders. The tricuspid ring is shown by the blue dotted line, and the mitral ring by the yellow dotted line. The dead-end tract is again shown by the yellow dashed line, with the “missing” part of the initial interventricular ring in the area of aortic-to-mitral fibrous continuity shown by the dotted yellow line. The view of the reconstruction in the right hand panel shows how the atrioventricular node and the retroaortic node, shown by the red circle with white borders, are formed at the intersections of the atrioventricular and interventricular rings.

