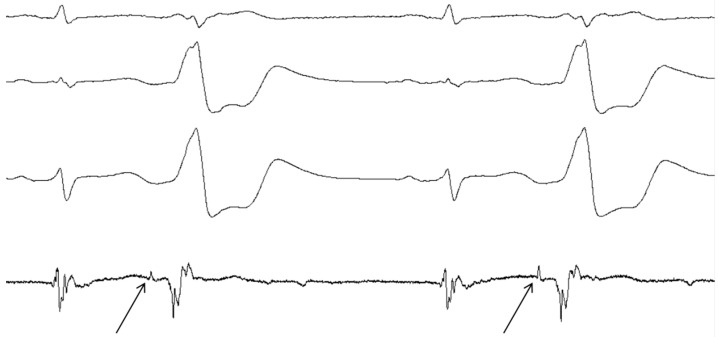
Figure 2.
Pre-potentials on Intracardiac ECG. Intracardiac ECG of a patient from our center during catheter ablation of a VA originating from the AMC. Shown are a sinus complex followed by a PVC, which is then repeated. The arrows indicate the pre-potentials representing conduction over some kind of tract with an isoelectric interval of 92 ms.

