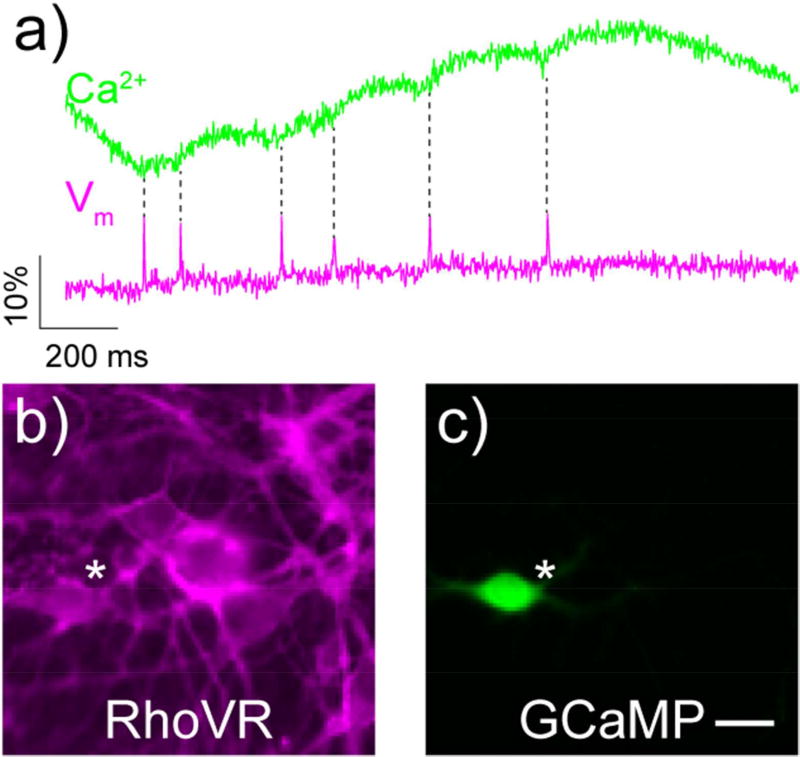
Figure 3.
Comparison of voltage and Ca2+ imaging in neurons. a) Ca2+ (green) and voltage (magenta) responses to single, spontaneously-arising action potentials in the same rat hippocampal neuron, as recorded by GCaMP6s (green) and the voltage-sensitive dye, RhoVR 1 (magenta). Panels b and c depict the neuron (white star) analyzed in part a. Scale bar is 20 µm. Figure adapted from Deal, et al., 2017. [note: single column figure]

