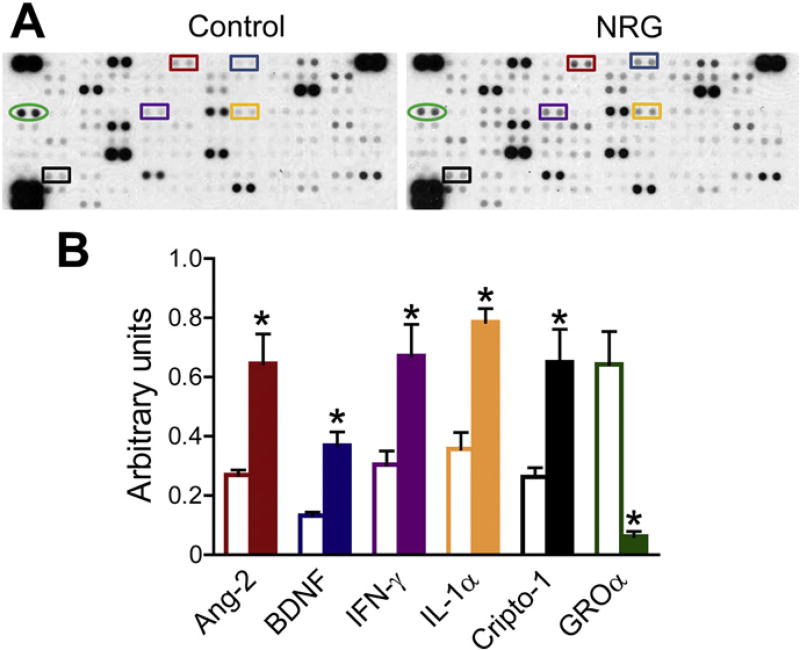
Fig. 8.
Cytokines secreted from neuregulin-treated fibroblasts. A, representative immunoblots show differentially expressed cytokines in the supernatants collected from NHCV fibroblasts that were untreated or treated for 24 h with NRG-1β. Each cytokine is represented on the array in duplicate, and each array includes three positive references (top left, top right, and bottom left) as well as negative reference spots (bottom right). Colored squares indicate significantly differential cytokines. B, graphical representation of differentially expressed cytokines identified using cytokine profile arrays. Data includes densitometry analysis results for three replicate experiments conducted using NHCV fibroblast cell populations established from three separate individuals (n = 3, *p < 0.05 for NRG-1β-treated cells, when compared to the various control treatments). Open and solid bars represent untreated control cells and NRG-1β-treated cells, respectively. Bar colors correspond to colors of squares shown in A.

