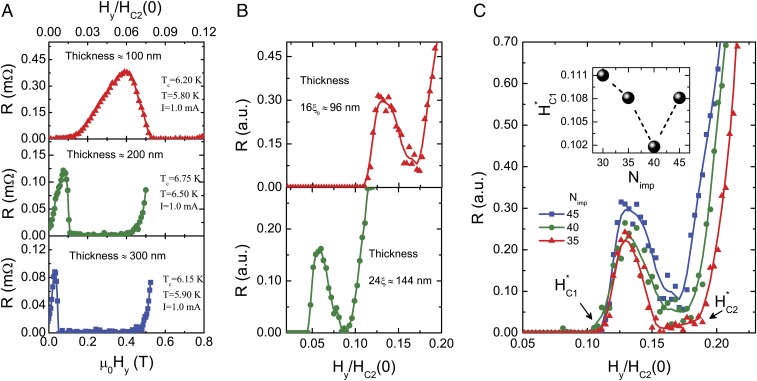
Fig. 4.
Effect of strip thickness and defect concentration. (A) Parallel field-dependent resistance for samples with thickness of nm (Top), nm (Middle), and nm (Bottom). The corresponding sample and measurement parameters are listed in the keys. (B) TDGL simulation result of the dissipation voltage for two samples with different thicknesses: and . The concentration of defects in both samples is similar, indicated by the higher number of impurities in the thicker sample. (C) Simulation results for the parallel field dependence of the voltage (magneto-resistance) at fixed temperature and applied current . The different curves show the dependence on the disorder (measured in the number of spherical impurities). Increase in the number of defects results in an overall increase of the voltage. C, Inset shows the nonmonotonic dependence of the lower critical-field onset, , of the resistive state as function of the number of impurities in the sample in a fixed-size system.

