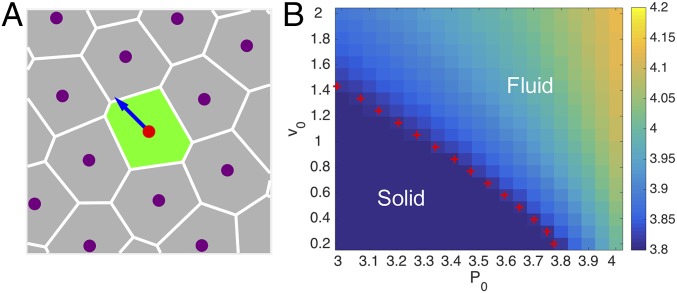
Fig. 1.
(A) Illustration of the SPV model, where cells are represented by polygons obtained via a Voronoi tessellation of initially random cell positions, with a self-propulsion force applied at each cell position. (B) Phase diagram in the plane based on the value of the shape parameter (color scale), with the phase boundary (red crosses) determined by .

