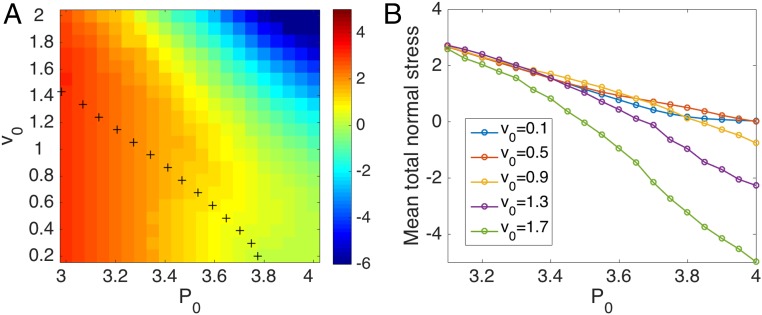
Fig. 3.
Mean total normal stress. (A) Heat map of the mean total normal stress of the tissue in the plane. The black crosses outline the solid–liquid phase boundary determined by . Red indicates contractile stress and blue extensile stress. (B) Mean total normal stress as a function of at various , showing a change in sign deep in the liquid state ( cells for and with periodic boundary condition).

