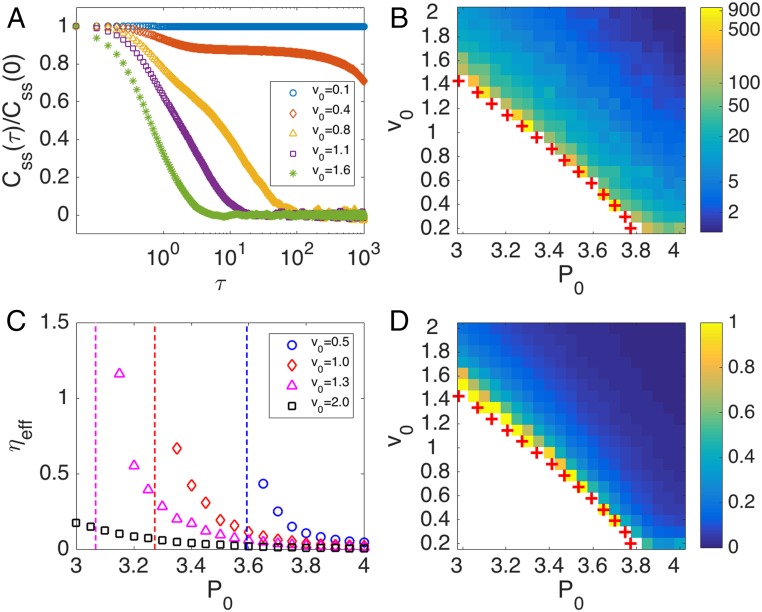
Fig. 4.
Time autocorrelation of interaction shear stress and effective tissue viscosity. (A) Time autocorrelation function of the mean interaction shear stress for at various . (B and D) Heat maps of the correlation time (B) and of the effective viscosity (D). The red crosses denote the liquid–solid phase transition boundary determined by . The white region corresponds to regions where correlation time and effective viscosity diverge. Note that these regions largely coincide with the solid regime. (C) The effective viscosity as a function of at various . The dashed lines correspond to the critical where the liquid–solid phase transition occurs. All results are for cells, , and with periodic boundary condition.

