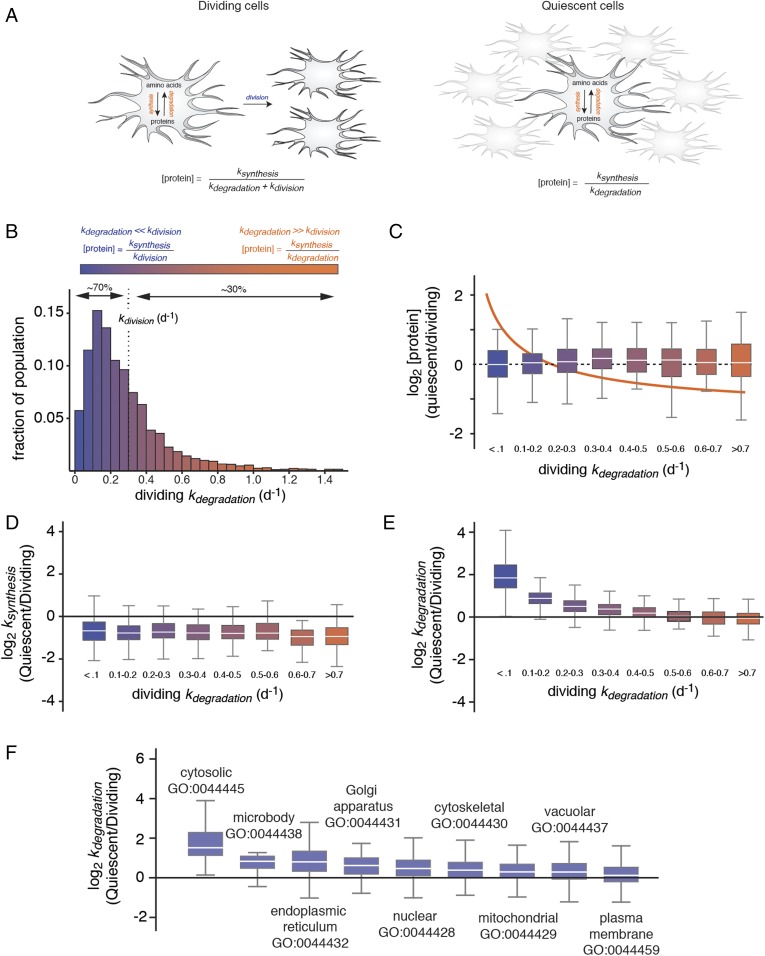
Fig. 1.
Selective degradation of long-lived proteins mitigates their accumulation in quiescent cells. (A) Schematic outlines the relationship between [protein], ksynthesis, kdegradation, and kdivision in dividing and quiescent cells. (B) The measured distribution of kdegradation in dividing cells indicating the percentage of the proteome with kdegradation values greater or less than kdivision. These two classes of proteins are referred to as “short-lived” and “long-lived,” and their clearance is dominated by degradation and cell division, respectively. (C) Relationship between relative protein expression levels in quiescent and dividing cells to kdegradation in dividing cells. Box plots indicate the distribution of log2 [protein] ratios within different ranges of kdegradation in dividing cells. The box indicates the interquartile range (IQR), and the line indicates the median. Far outliers (>1.5*IQR) were excluded. The color scale refers to distribution shown in B. The orange line indicates the theoretical relationship between log2 [protein] ratios and kdegradation in the absence of changes in kdegradation and ksynthesis between dividing and quiescent cells (see kinetic model). (D) Relationship between relative protein synthesis rates in quiescent and dividing cells to kdegradation in dividing cells. (E) Relationship between relative protein degradation rates in quiescent and dividing cells to kdegradation in dividing cells. (F) Box plots indicate the distribution of log2 ratio of kdegradation measurements between quiescent and dividing cells for proteins mapped to different gene ontology (GO) component accessions.

