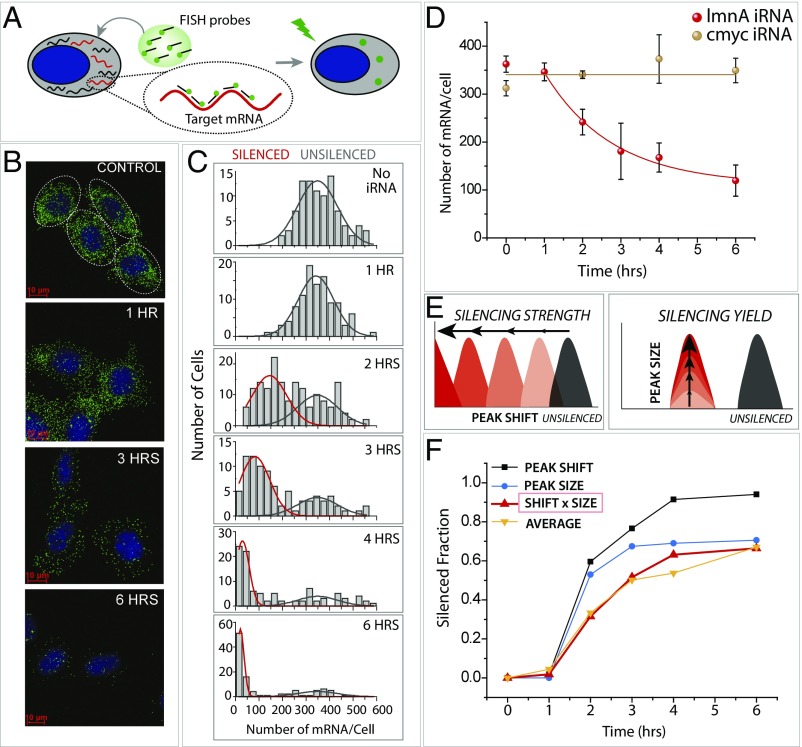
Fig. 1.
Quantitation of RNA silencing in single cells using smFISH. (A) smFISH is performed by applying 32 fluorescently labeled oligonucleotides bearing a sequence complementary to the target mRNA (lamin A) to fixed and permeabilized cells. It enables visualizing individual mRNA molecules in single cells. (B) smFISH images of individual cells in control cells (no iRNA) and 1, 3, and 6 h after iRNA treatment. (C) Quantification of smFISH data plotted as a function of hours after silencing. (D) Target-specific and nonspecific iRNA treatment leads to LMNA mRNA reduction only in case of lmnA iRNA. (E) Two types of parameters that characterize efficiency of RNAi are horizontal peak shift and vertical peak size reduction. (F) Peak shift, peak size, peak shift × peak size, and the average (average number of mRNAs tracked over time of silencing was converted to a silenced fraction) per cell plotted over time of RNA silencing.

