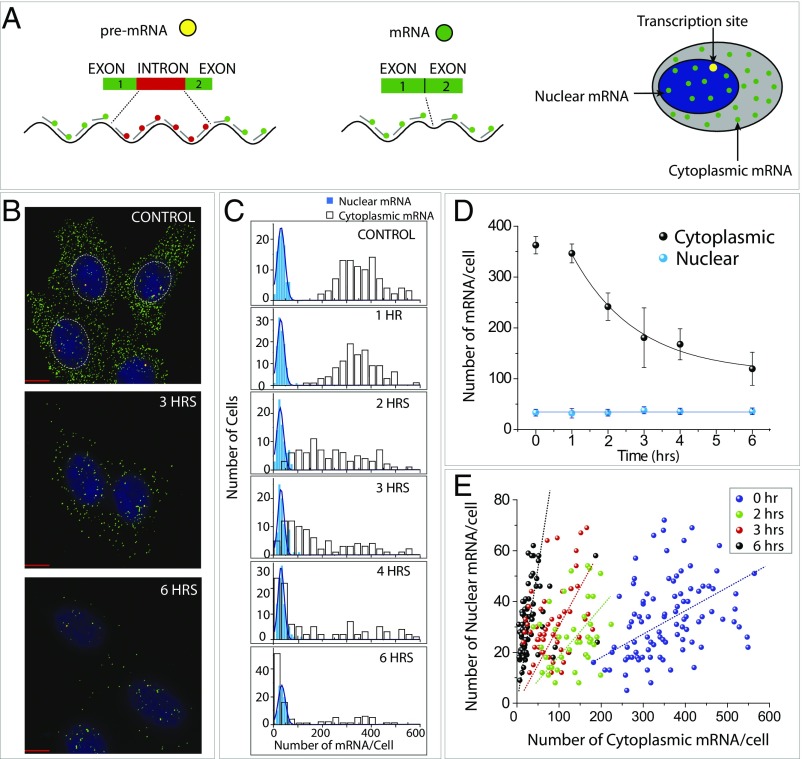
Fig. 2.
RNAi reduces cytoplasmic mRNA without changing nuclear mRNA. (A) Visualization of nuclear mRNA by using dual-color smFISH including green-labeled probes designed against the exon and the red probes against the intron. Yellow spots are produced by the overlap of green and red represent active transcription sites, whereas green spots are nuclear mRNA. (B) Representative dual-color smFISH image displaying the exon and intron of lamin A mRNA taken at 0, 3, and 6 h after iRNA treatment. (C) The histogram shows nuclear (blue bars) and cytoplasmic (white bars) mRNAs as a function of silencing time. (D) Count of nuclear (blue) vs. cytoplasmic mRNA (black) per cell. (E) The number of nuclear mRNA per cell plotted against number of cytoplasmic mRNA per cell for 1, 2, 3, and 6 h postsilencing.

