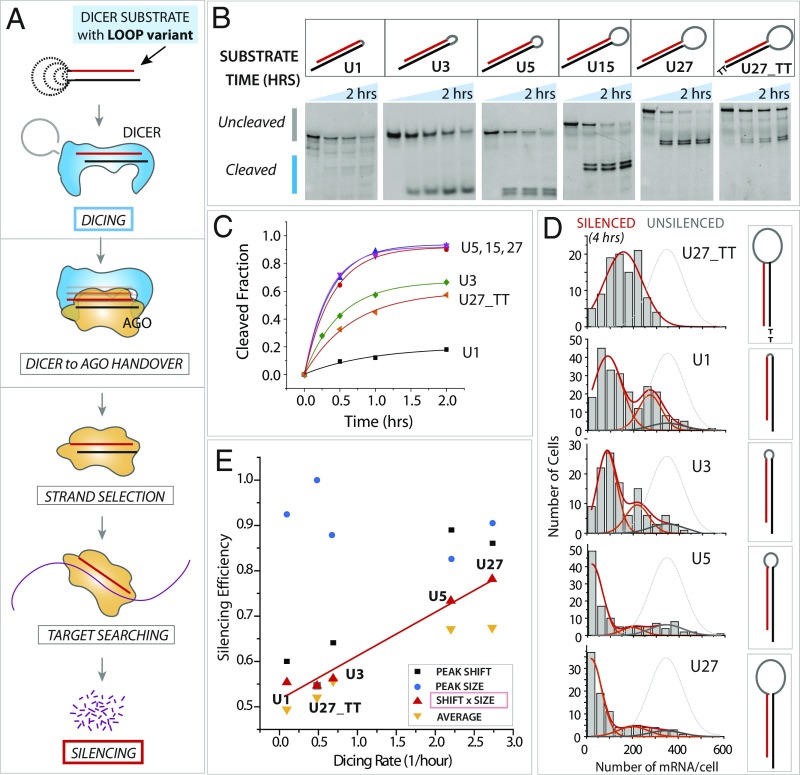
Fig. 3.
Dicing kinetics is correlated with gene-silencing efficiency. (A) Schematic of the RNAi pathway, which involves dicing, Dicer-to-Ago handover, strand selection, target searching, and mRNA silencing. (B) Dicing results on loop length variants of U1, U5, U15, U27, and U27 with TT overhang. (C) Quantification of dicing rate. (D) mRNA histogram of loop length variants after 4 h of silencing. (E) Silencing efficiency plotted against dicing rate for loop length variants. The peak size (blue symbols) is similar for all RNAs, but the peak shift (black symbols) and shift × size (red symbols) show a linear correlation between the dicing rate and silencing efficiency. See Fig. 1 E and F for fitting parameters.

