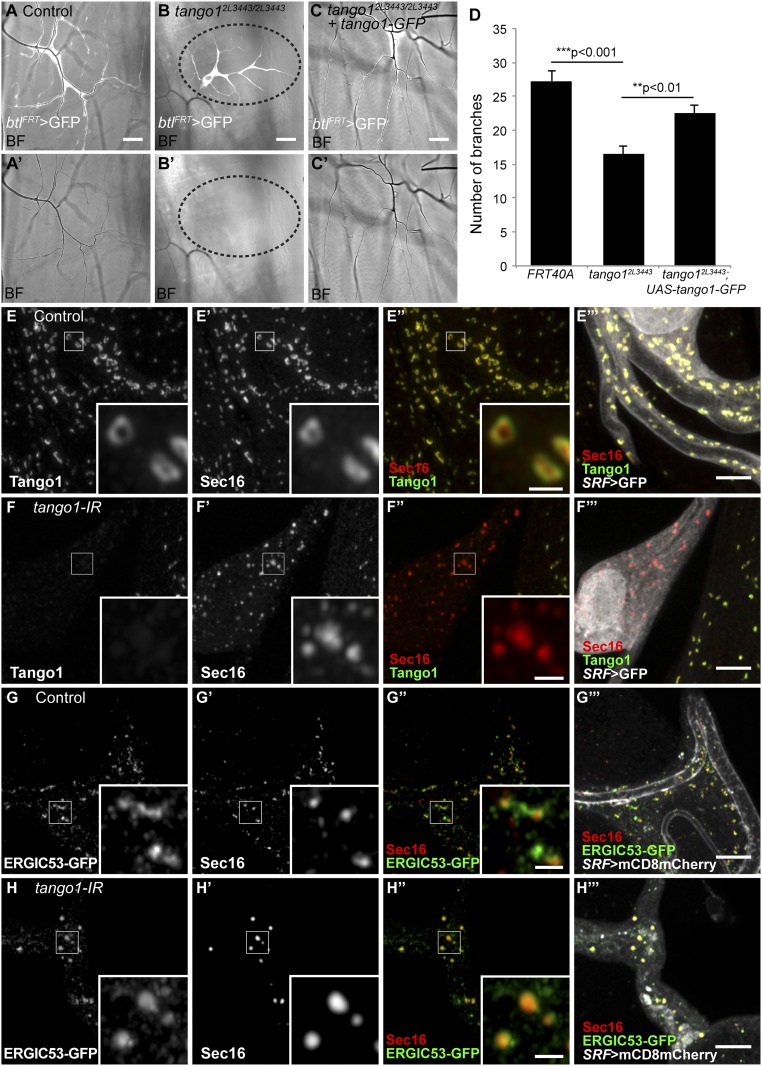
Fig. 1.
Effect of loss of Tango1 on cell, ER, and Golgi morphology. (A–C) Bright field (BF) images of homozygous tango12L3443 mutant tracheal cells expressing GFP (btlFRT > GFP) allow the visualization of number of branches and the presence of air in terminal cells. Unlike control cells (A and A′), homozygous tango12L3443 cells are not air-filled (area surrounded by dotted line in B and B′). (C and C′) Expression of Tango1-GFP in mutant cells suppresses the air-filling defects and reestablishes near-normal number of branches (D). Control, n = 11; tango12L3443, n = 14; tango12L3443+Tango1-GFP, n = 11. Bars represent mean ± SEM. Significance was determined using two-tailed t test. (E–H) Airyscan microscopy images of control (E and G) and tango1 knockdown cells (F and H), stained for Tango1 (E–F) and Sec16 (E′–F′) and for ERGIC53-GFP (G–H; fTRG library, expressed at endogenous levels) and Sec16 (G′–H′). Insets in E–H are magnifications of representative regions, indicated by the white squares. (Scale bars: A–C, 40 μm; E–H, 5 μm; Insets, 1 μm.)

